Moving Averages: EMA20, EMA50, EMA200, EMA9, EMA18Mi estrategia es tener a mano varias medias móviles, que la mayoría de los traders usan , que sirven para hacer scalping, binarias,etc
חפש סקריפטים עבור "moving averages"

Forex Multi-Factor IndicatorMoving Averages (MA):
Two moving averages are plotted on the chart: a fast MA (blue line) and a slow MA (red line).
The fast MA is calculated using a shorter period (10 periods by default), while the slow MA is calculated using a longer period (30 periods by default).
Moving averages help identify trends by smoothing out price fluctuations. When the fast MA crosses above the slow MA, it suggests a bullish trend, and when the fast MA crosses below the slow MA, it suggests a bearish trend.
Relative Strength Index (RSI):
The RSI indicator (orange line) is plotted on a separate axis.
RSI measures the speed and change of price movements and oscillates between 0 and 100.
RSI values above 70 are considered overbought, indicating a potential reversal to the downside, while RSI values below 30 are considered oversold, indicating a potential reversal to the upside.
Volume Moving Average (Volume MA):
The volume moving average (purple line) is plotted on the same axis as the volume.
The volume moving average is calculated over a specified period (20 periods by default).
Volume analysis provides insights into the strength of price movements. When the volume increases along with price movements, it suggests strong conviction from traders.
Buy and Sell Signals:
Buy signals (green triangle) are generated when all of the following conditions are met:
The fast MA crosses above the slow MA (indicating a bullish trend).
The RSI is below the oversold level (indicating potential upward momentum).
The current price is above the fast MA, and the volume is higher than the volume MA (indicating positive volume trend).
Sell signals (red triangle) are generated when all of the following conditions are met:
The fast MA crosses below the slow MA (indicating a bearish trend).
The RSI is above the overbought level (indicating potential downward momentum).
The current price is below the fast MA, and the volume is lower than the volume MA (indicating negative volume trend).
Overall, this multi-factor indicator combines moving averages, RSI, and volume analysis to identify potential buying and selling opportunities in the Forex market. Traders can use the signals generated by this indicator as part of their trading strategy, but it's important to consider other factors such as risk management and market conditions before making trading decisions

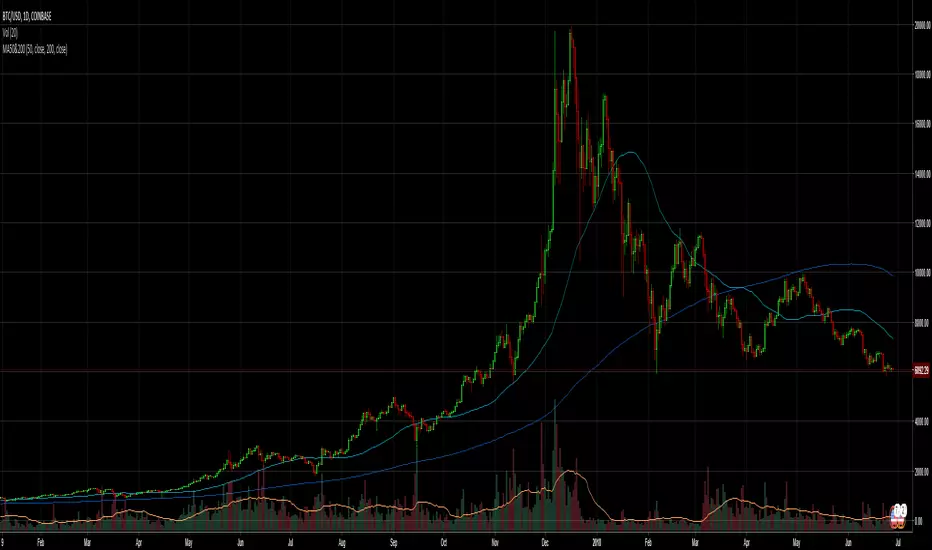
Exponential MA Channel, Daily Timeframe (Crypto)Moving averages are some of the most common tools for traders. Some of the most widely used ones are simple moving averages (e.g. 20SMA, 50 SMA, 100 SMA, 200SMA,...). There are endless combinations of moving averages that can be used. I prefer to use exponential moving averages because they react more quickly to price data (essentially they filter back through the data over a discrete number of timesteps, with more recent history receiving the highest weighting in the final calculation).
This script uses a combination of the 21EMA, 53 EMA, and 100EMA. The idea of this script is to provide insight into when an asset might be close to a local top/bottom by monitoring price within the middle channel (yellow, blue, and orange lines), as well as identifying longer timeframe opportunities to buy/sell by examining the upper (green) and lower (red) bands. Disclaimer: this is not a guarantee that if price enters a region, that it will be a top or bottom, it is simply an indicator to get an idea based on price history.
As far as I know, this particular combination of exponential moving averages has not yet been published. I do not have an infinite amount of time to check through the entire library of published scripts. If someone else has already done this, I was unaware. Numerical computations were performed on ETHBTC price data in order to find the coefficients used in this script. Essentially, each EMA has a multiplier of either 1, a fraction of 1, or a number larger than 1 (these are the numbers in the script being multiplied by 'out1', 'out2', 'out3'; feel free to change these and see how this changes the indicator). I have found it to be useful for myself, and hope other people can tinker with this idea. My only wish is to allow other people to use this starting point to explore for themselves. I hope that I am allowed to publish this script without it being taken down so that others can freely use it.
Recommendations: although this was fit specifically for ETHBTC, it appears useful for many crypto pairs, specifically alt-BTC pairs and crypto-USD pairs. For example, I have found it useful for BTCUSD, ETHUSD, LINKUSD, LINKBTC, ETHBTC, ADABTC, etc. Only use on the DAILY timeframe.


FishNet Doubled hullMA Reactive ColorsMoving averages are used to determine trend. These moving averages are designed to determine trend with reactive coloring and utilizes a unique version of the Hull moving average. This is one of many iterations of fishnet MAs I have made in the past.
I first found fishnet MAs, which is a lot of moving averages of increasing length, from @TusenPix
YMMV on actionable information :p

Moving Average Speed Can Spot Turns Before They HappenMoving averages are perhaps the most common indicator in the world of technical analysis, highlighting trends over time by smoothing out values.
Because they show direction, moving averages inevitably rise or fall. These changes are often obvious in retrospect, but now they can be spotted as they happen with our MA Speed script.
This indicator calculates one of five kinds of moving averages (including exponential and volume-weighted). Users can set the length (50-day SMA by default). They can even pick whether it calculates based on open, high, low, close, etc. (Close is the default.)
MA Speed plots the simple 1-day percentage change similar to an oscillator at the bottom of the chart, color-coding for positive or negative values.
The chart above applies MA Speed to the S&P 500 . The result is pretty interesting because we can see how its 50-day SMA was falling at 0.67 percent in March, the fastest decline since December 2008. But this month it’s flattened quickly and is on pace to turn higher in the next session or two.

Rainbow Collection - VioletMoving averages come in all shapes and types. The most basic type is the simple moving average which is simply the sum divided by the quantity. Therefore, the simple moving average is the sum of the values divided by their number.
In technical analysis, you generally use moving averages to understand the underlying trend and to find trading signals. In the case of the Violet indicator, we are using a Hull moving average which is a special variation based on different weights to minimize lag.
The Violet indicator is therefore used as follows:
* A bullish signal is generated whenever the close price surpasses the 20-period Hull moving average while the previous close prices from periods were all below their respective Hull moving average of the period.
*A bearish signal is generated whenever the close price breaks the 20-period Hull moving average while the previous close prices from periods were all above their respective Hull moving average of the period.
The aim of the Violet indicator is to capture reversals as early as possible through a combination of lagged conditions based on the Fibonacci sequence.

Multi Time frame Moving AverageMoving averages has been simple yet powerful tools and combination of these on co-ordinates of length/time frame can give us information on bullish/bearish and sideways market.
i have tried to look moving averages on time-frame dimension in this script rather than making combination of look back period length
script include type of moving average selection and plotting that on 5 user specified time frames. Allow repaint feature using security function has also been allowed in script.

Francesco's Ultimate Moving Average-MTFMoving Averages for potential upside buys. Features three different moving averages to indicate uptrends and downtrends for swing trading.


Overbought or Oversold? Check Distance From MAMoving averages are one of the most basic tools for technical analysts. They can be useful for both trend analysis and for mean reversion.
But how can you know when price is historically overbought or oversold relative to a moving average? Distance from MA can help.
This indicator calculates the distance from a moving average as a percentage and plots the result as an oscillator. Values above 0 appear in green, while negative readings are colored red.
This chart highlights the depth of the S&P 500's recent selloff. As you can see, the close dipped to 25 percent below its 50-day SMA on Monday. That was its most oversold condition since November 20, 2008 -- in the middle of the subprime financial crisis.
Distance from MA can handle five types of moving average. Simply change the "AvgType" input according to this key:
1 - Simple Moving Average
2 - Exponential Moving Average
3 - Hull Moving Average
4 - Weighted Moving Average
5 - Volume-Weighted Moving Average

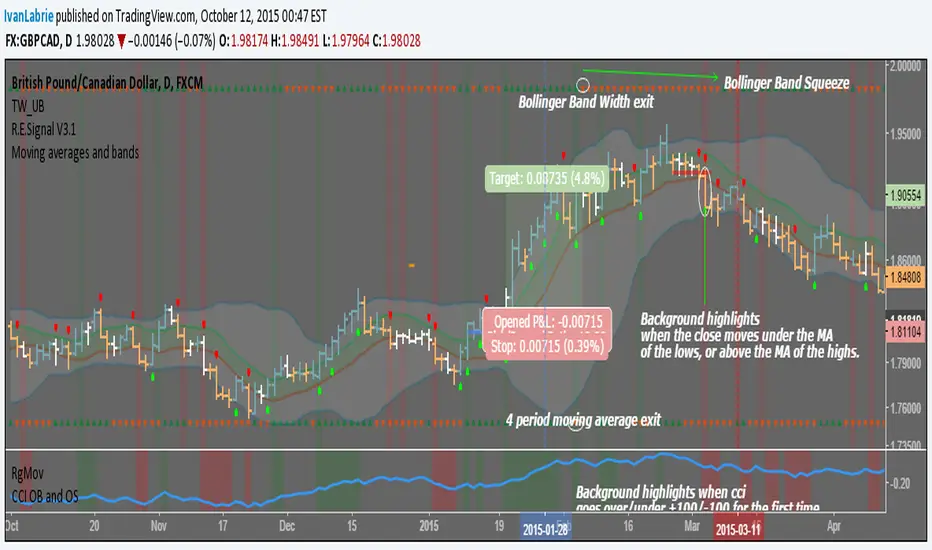
Moving averages and bandsI coded this simple indicator based on multiple ideas shared by Tim West at his "Key Hidden Levels" chatroom.
We have a moving average ribbon comprised of the average of the highs and lows in 10 periods. The colored space in between acts more or less like fair value and is often where price is when consolidating.
Green and red triangles at the top and bottom of the screen.
The ones at the bottom, correspond to signals obtained from a 4 period moving average of the close's slope. It helps get excellent exits for trending moves by changing color with the moving average slope.
The ones at the top, are green while Bollinger Band Width increases, and red while it decreases, relative to the previous bar.
Background color highlights when the close moves over the moving average of the highs or under the moving average of the lows, indicating a change of trend is possible, or at least a pause/consolidation.
The idea is to have multiple reasons to stay in a trade, which is normally very hard to do, specially when winning.
Cheers,
Ivan Labrie
Time at Mode FX
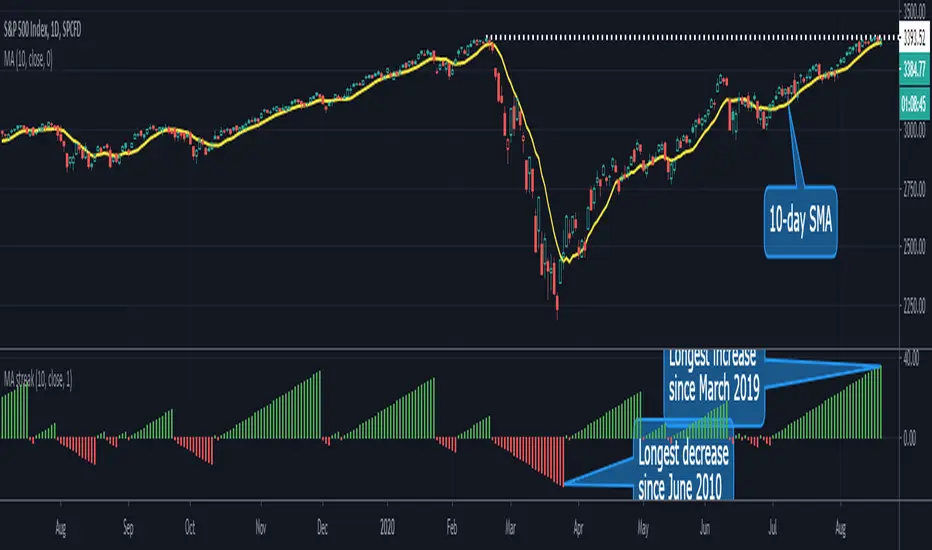
MA Streak Can Show When a Run Is Getting Long in the ToothMoving averages are one of the most common indicators in the world of technical analysis. And they’re often the ingredients of more complex indicators like MACD.
Today’s script shows how long prices have been moving in a given direction. Similar to our earlier Price Streak script, MA Streak counts the number of sessions that the average is rising or falling. It then plots the result in green (positive, rising) or red (negative, falling).
Because it uses a moving average instead of individual candles, this smooths out short-term noise to illustrate how long prices have been moving in a given direction.
Users can designate which price value (open, high, low, etc) to use under the Source input. They can also chose one of five moving average types. (See the code for a complete guide.)
Today’s chart shows that the S&P 500’s 10-day simple moving average (SMA) has been rising for 36 sessions. It’s the longest upside run since March 2019. Given the fact that the index is flirting with its pre-Covid highs, MA Streak may suggest the current rally is getting long in the tooth.
It's also noteworthy that the coronavirus correction in February and March saw the 10-day SMA drop for 24 straight sessions, which was its longest decline since June 2010.
Moving Averages 50 & 200Moving Average Indicator for trading 50MA and 200MA crossovers (golden cross and death cross).
A golden cross is considered a bullish sign; it occurs when the 50-day moving average rises above 200-day moving average. A death cross is considered a bearish sign; it occurs when the 50-day moving average drops below 200-day moving average.
Volume, Momentum and Volatility weighted moving averageMoving averages are filters on price data. This moving average creates a filter which factors in:
- the price RSI or it's Momentum
- the volume RSI
- the RVI or Volatility
Each factor is put through a least squares filter to smooth them first.
Then the factors are used to build a coefficient for an exponentially weighted average.
The chart above shows a comparison of standard average types with this script.
This is useful if you are looking for a moving average based trigger and do not wish to react to candle noise price action.

Moving Averages with ADR%/ATR/52W/Market Cap TableMoving Average
ADR
ATR
52 Week High/Low
Market Cap

Moving Average RibbonMoving Averages creating a what I call internally a "ribbon". Rename as see fit.


Moving Averages with Crossovers and Interchangeable 200 EMA
just basic standard emas. used for technical analysis and reading institutional flow

Moving Averages + Premarket High/Low + Yesterday High/Low V2This script allows you to have multiple indicators on the chart at once. EMA's can be added to lower timeframes while SMA's can be added to higher timeframes. Premarket high and low are also tracked as well as yesterdays high and low. All these points are crucial in technical analysis as current price action can either bounce or reject off of these levels.
Update: Fixed an issue where high/low was showing for current trading day during market hours instead of previous trading day

Moving Averages & PivotsOptional MA and Pivots which can be changed as per your needs.
Moreover you can opt to see all and none at all or some.

